Grafana Dashboards for SANsymphony Metrics
Once SANsymphony metrics are collected in Prometheus, you can optionally create Grafana dashboards to visualize metrics data such as virtual disk status, storage pool capacity, system health, and more.
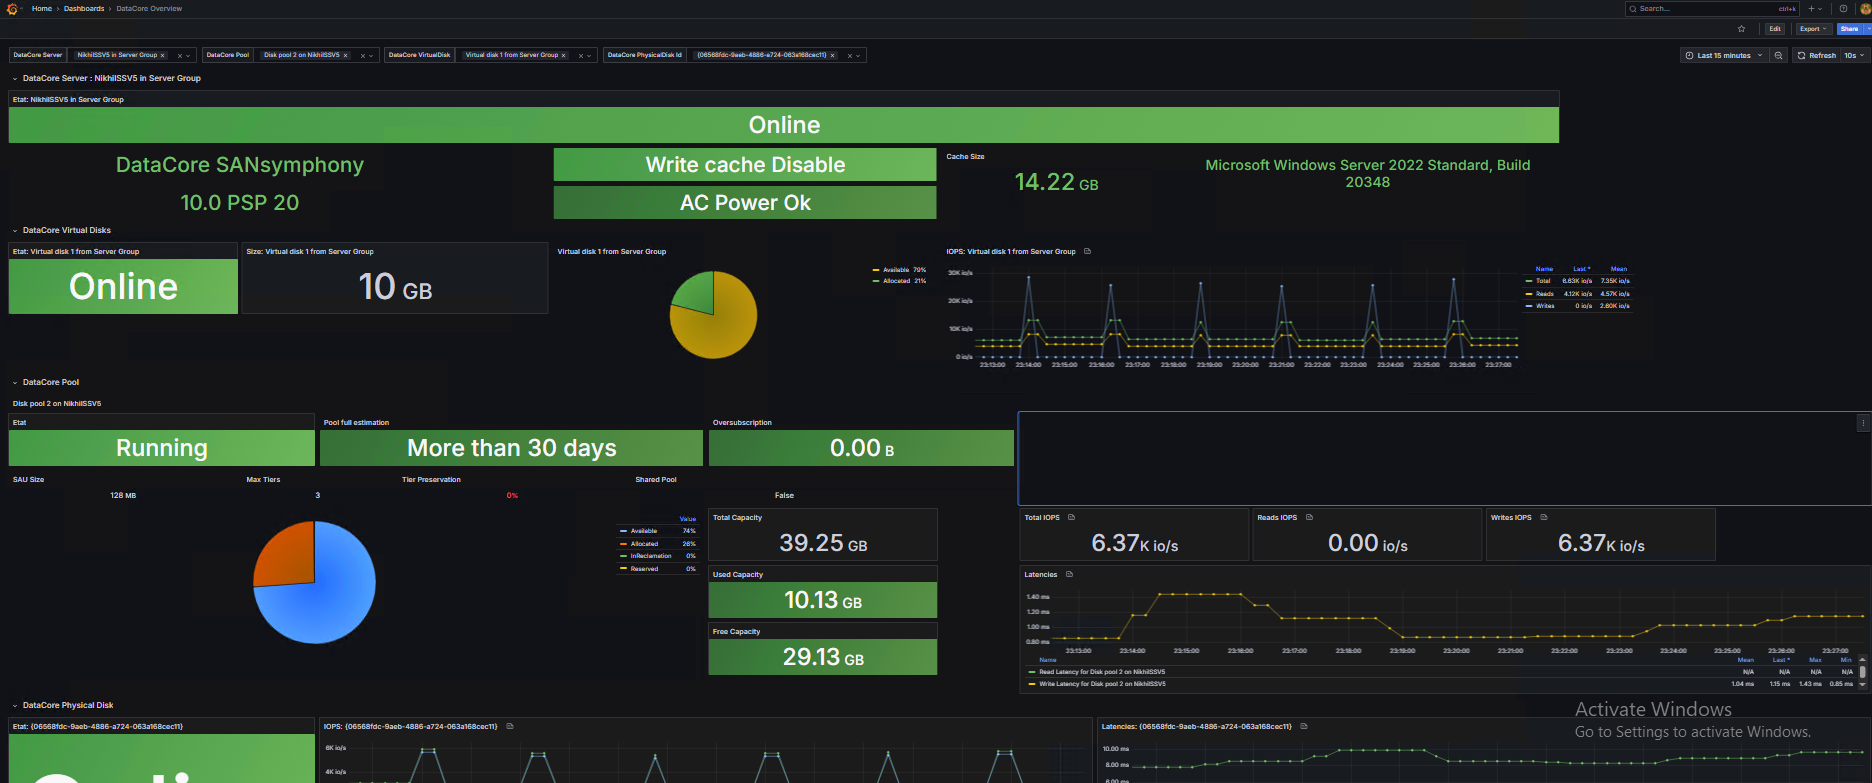
The example below shows a custom Grafana dashboard built using SANsymphony Prometheus exposition metrics. This provides a real-time, graphical view of SANsymphony operations and is useful for monitoring and capacity planning. Dashboard creation is fully customizable based on your specific monitoring needs.
Sample Dashboards on Grafana Labs
You can also access the following sample dashboards, which are publicly available on Grafana Labs. To browse these dashboards, visit the Datacore Dashboards | Grafana Labs.
After importing any of these sample dashboards from Grafana Labs, select the Prometheus data source that contains the SANsymphony metrics. The dashboards will then automatically populate with live SANsymphony data, enabling quick and effective visualization.
Learn More